Code Optimizer for Laravel: 5,361 Queries Down to 5
By Nihar Ranjan Das · Sat Oct 10 2026 · 11 min read · 1 views
View as a Web StoryAISoftware#performance#AI coding#Laravel#eloquent#n-plus-one
A Laravel route that lists 1,800 articles made 5,361 database queries and took 2,326 ms in my test. Four changes cut it to 5 queries and 4 ms. Eager loading did the most for the query count. Three missing indexes did the most for the time. Pagination did the most for memory.
This post walks through each fix with the numbers I measured. It also shows what one pass of an AI code optimizer fixed on its own, and what it left behind. If your app feels slow and you do not know where to start, the order of the steps is the useful part.
What does a code optimizer do for a Laravel route?
A code optimizer is a person or tool that finds needless work in your code and removes it. In a Laravel route that work is almost always one of four things. Those are queries inside a loop, queries that scan a whole table, columns nobody reads, and rows nobody asked for.
A code optimizer can be a person with a profiler; it can be a static tool such as Larastan. It can also be an AI assistant that rewrites the route. All three need the same thing first: a number to beat. Without a measured baseline you cannot tell a fix from a guess.
The route below is the baseline I used; each section changes one thing and measures again.
What was the test setup?
The test setup was a fresh Laravel 13.35 app on PHP 8.4 with a SQLite file database. I seeded 2,000 articles, 50 authors, 10,000 comments, 20 tags and 6,000 article-tag links with a fixed random seed. About one article in ten is unpublished.
I measured each route with a small script that boots the app, listens to every query with DB::listen, and dispatches the request five times. The table shows what the script reports.
| Measure | Source |
|---|---|
| Query count | DB::listen |
| DB time | DB::listen times |
| Median ms | Five requests |
| Peak MB | memory_get_peak_usage |
This is not a load test. It measures one request on one laptop, which is enough to compare versions of the same route against each other. Treat the absolute milliseconds as relative.
Here is the starting route; it loops over every published article and touches three relations.
Route::get('/naive', function () {
    $out = [];
    foreach (Article::where('published', true)->orderBy('created_at', 'desc')->get() as $a) {
        $out[] = [
            'id' => $a->id,
            'title' => $a->title,
            'author' => $a->author->name,
            'comments' => $a->comments->count(),
            'tags' => $a->tags->pluck('name'),
        ];
    }
    return $out;
});
Each query also carries fixed overhead beyond the time the database spends on it. The application must serialize the statement, send it across a connection, wait for the response, and hydrate every returned row into an Eloquent model. On a local SQLite file that overhead is small, but on a managed database in another availability zone it multiplies across thousands of statements, which is why the query count matters even when each statement is fast.
Advertisement
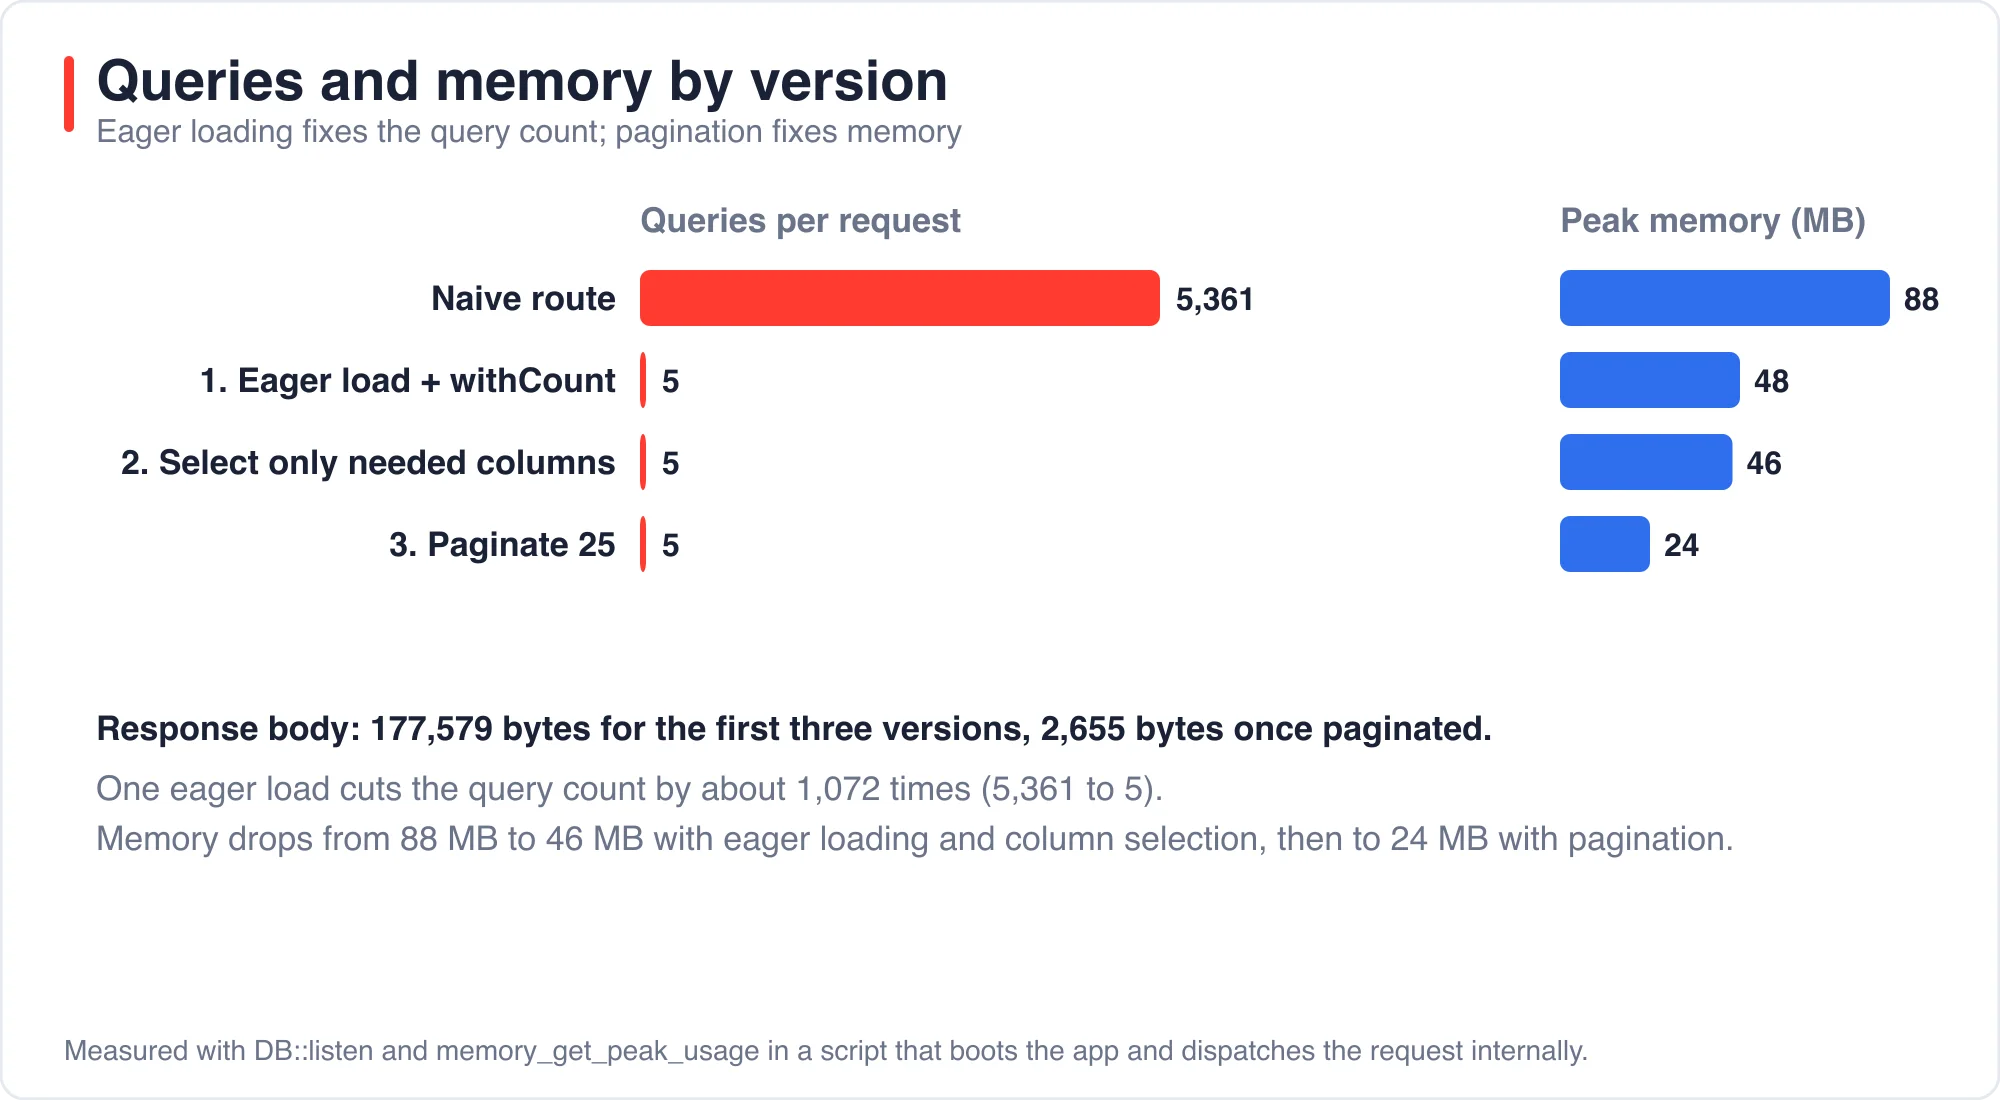
This route made 5,361 queries, took 2,326 ms and peaked at 88 MB. It returned 177,579 bytes of JSON.
How do you fix N+1 queries in Laravel?
An N+1 query is a loop that runs one extra query per row, so 1,800 articles cost 1,801 queries or more. You fix it by loading the relations in bulk before the loop, using with() for related models and withCount() for counts. Eager loading is Laravel's way of fetching related models in bulk, documented in Eloquent relationships. One query fetches the articles, then one query per relation fetches all related rows at once.
Here is the same route after that change.
Route::get('/s1', fn () => Article::where('published', true)
    ->orderBy('created_at', 'desc')
    ->with(['author', 'tags'])
    ->withCount('comments')
    ->get()
    ->map(fn ($a) => [
        'id' => $a->id,
        'title' => $a->title,
        'author' => $a->author->name,
        'comments' => $a->comments_count,
        'tags' => $a->tags->pluck('name'),
    ]));
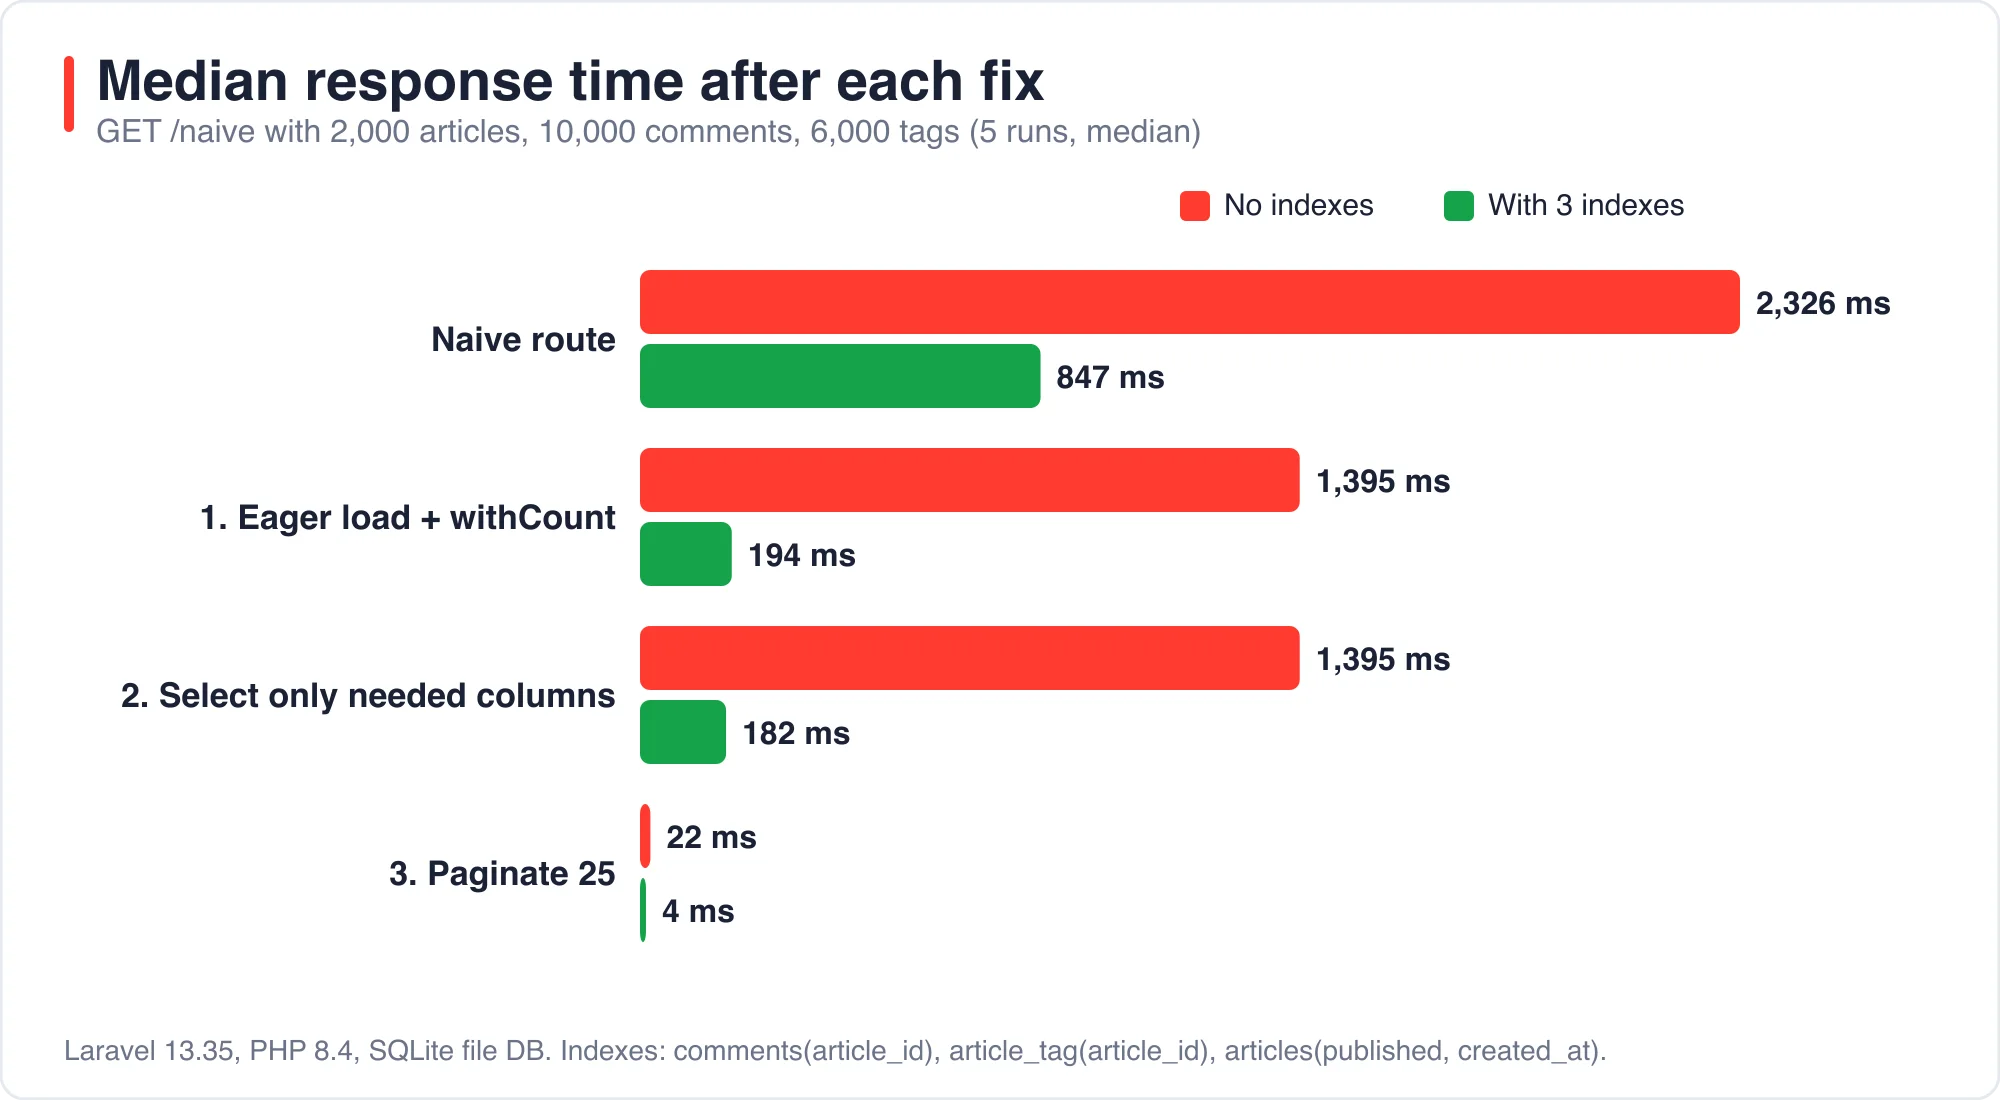
The query count fell from 5,361 to 5, a drop of about 1,072 times. Peak memory fell from 88 MB to 48 MB, because the route no longer hydrated 1,800 comment collections just to count them.
The time did not fall as much as the query count; the median went from 2,326 ms to 1,395 ms. Five queries still took 1,190 ms in the database; that gap is the next section.
Why is the eager-loaded route still slow?
The eager-loaded route is still slow because the tables have no indexes on the columns the queries filter by. SQLite does not add an index for a foreign key; the migrations Laravel generates do not add one either. Each lookup scans the whole table.
The SQLite query planner shows the problem. I asked it to explain the comment count subquery that withCount('comments') generates. The SQLite documentation on the query planner explains how to read this output.
QUERY PLAN
|--SCAN a
|--CORRELATED SCALAR SUBQUERY 1
|  `--SCAN c
`--USE TEMP B-TREE FOR ORDER BY
SCAN c means SQLite reads all 10,000 comments once for every article. That is the 1,190 ms. I added three indexes, one for each lookup the route performs.
Schema::table('comments', fn ($t) => $t->index('article_id'));
Schema::table('article_tag', fn ($t) => $t->index('article_id'));
Schema::table('articles', fn ($t) => $t->index(['published', 'created_at']));
With the indexes, the eager-loaded route dropped from 1,395 ms to 194 ms. Database time fell from 1,190 ms to 11 ms. The same indexes also helped the naive route, which fell from 2,326 ms to 847 ms with no code change at all.
That result is worth remembering. If you can only do one thing today, add the indexes. If you can do two, add the indexes and then eager load.
Do you need to select fewer columns?
Selecting fewer columns saves bytes and memory, but it barely changed the time here. The body column holds 40 repeated sentences per article, so skipping it should help. Laravel lets you pass a column list to select() and to the relation constraints.
Route::get('/s2', fn () => Article::select('id', 'author_id', 'title', 'created_at')
    ->where('published', true)
    ->orderBy('created_at', 'desc')
    ->with(['author:id,name', 'tags:id,name'])
    ->withCount('comments')
    ->get()
    ->map($shape));
In my test this changed peak memory from 48 MB to 46 MB and the indexed median from 194 ms to 182 ms. That is a real saving, but a small one.
Column selection matters more when a table has a large text or JSON column and the rows are wide. Check the width of your rows before you spend time here. One caution: if you call select() after withCount(), the count column disappears. Put select() first.
Should the route paginate?
Yes, if the caller does not need every row at once. Pagination was the largest single change in memory and bytes. It also changes the response, so it needs a decision from whoever consumes the route.
Route::get('/s3', fn () => Article::select('id', 'author_id', 'title', 'created_at')
    ->where('published', true)
    ->orderBy('created_at', 'desc')
    ->with(['author:id,name', 'tags:id,name'])
    ->withCount('comments')
    ->simplePaginate(25)
    ->through($shape));
The Laravel pagination documentation describes simplePaginate() as the cheaper option because it skips the total count query. Use paginate() when the interface needs page numbers.
The response fell from 177,579 bytes to 2,655 bytes. Peak memory fell to 24 MB; the indexed median fell to 4 ms. Without indexes the same route took 22 ms, because the database still sorts and filters the whole table before it takes 25 rows.
How do you find the slow part before you fix it?
You find it with three checks, in this order. Each one takes under a minute and each one points at a different cause.
- Count the queries. Wrap the request in
DB::listenor callDB::enableQueryLog()in a test. A count that grows with the row count is an N+1 query. - Explain the slowest query. Run
EXPLAIN QUERY PLANin SQLite orEXPLAINin MySQL and PostgreSQL. ASCANor a full table scan on a large table means a missing index. - Check the payload. Compare the response size with what the page shows. A 177 KB response for a list of titles means unused columns or too many rows.
I ran these checks in the order shown on the naive route. The first showed 5,361 queries; the second showed the scan on comments. The third showed a payload far larger than a list of titles needs.
What did an AI code optimizer fix on its own?
An AI code optimizer fixed the code but not the schema. I gave Claude Code one prompt. It said the /naive route is slow, asked for a faster version with the same JSON, and pointed at the bench script. I let it edit files and run php and sqlite3 commands.
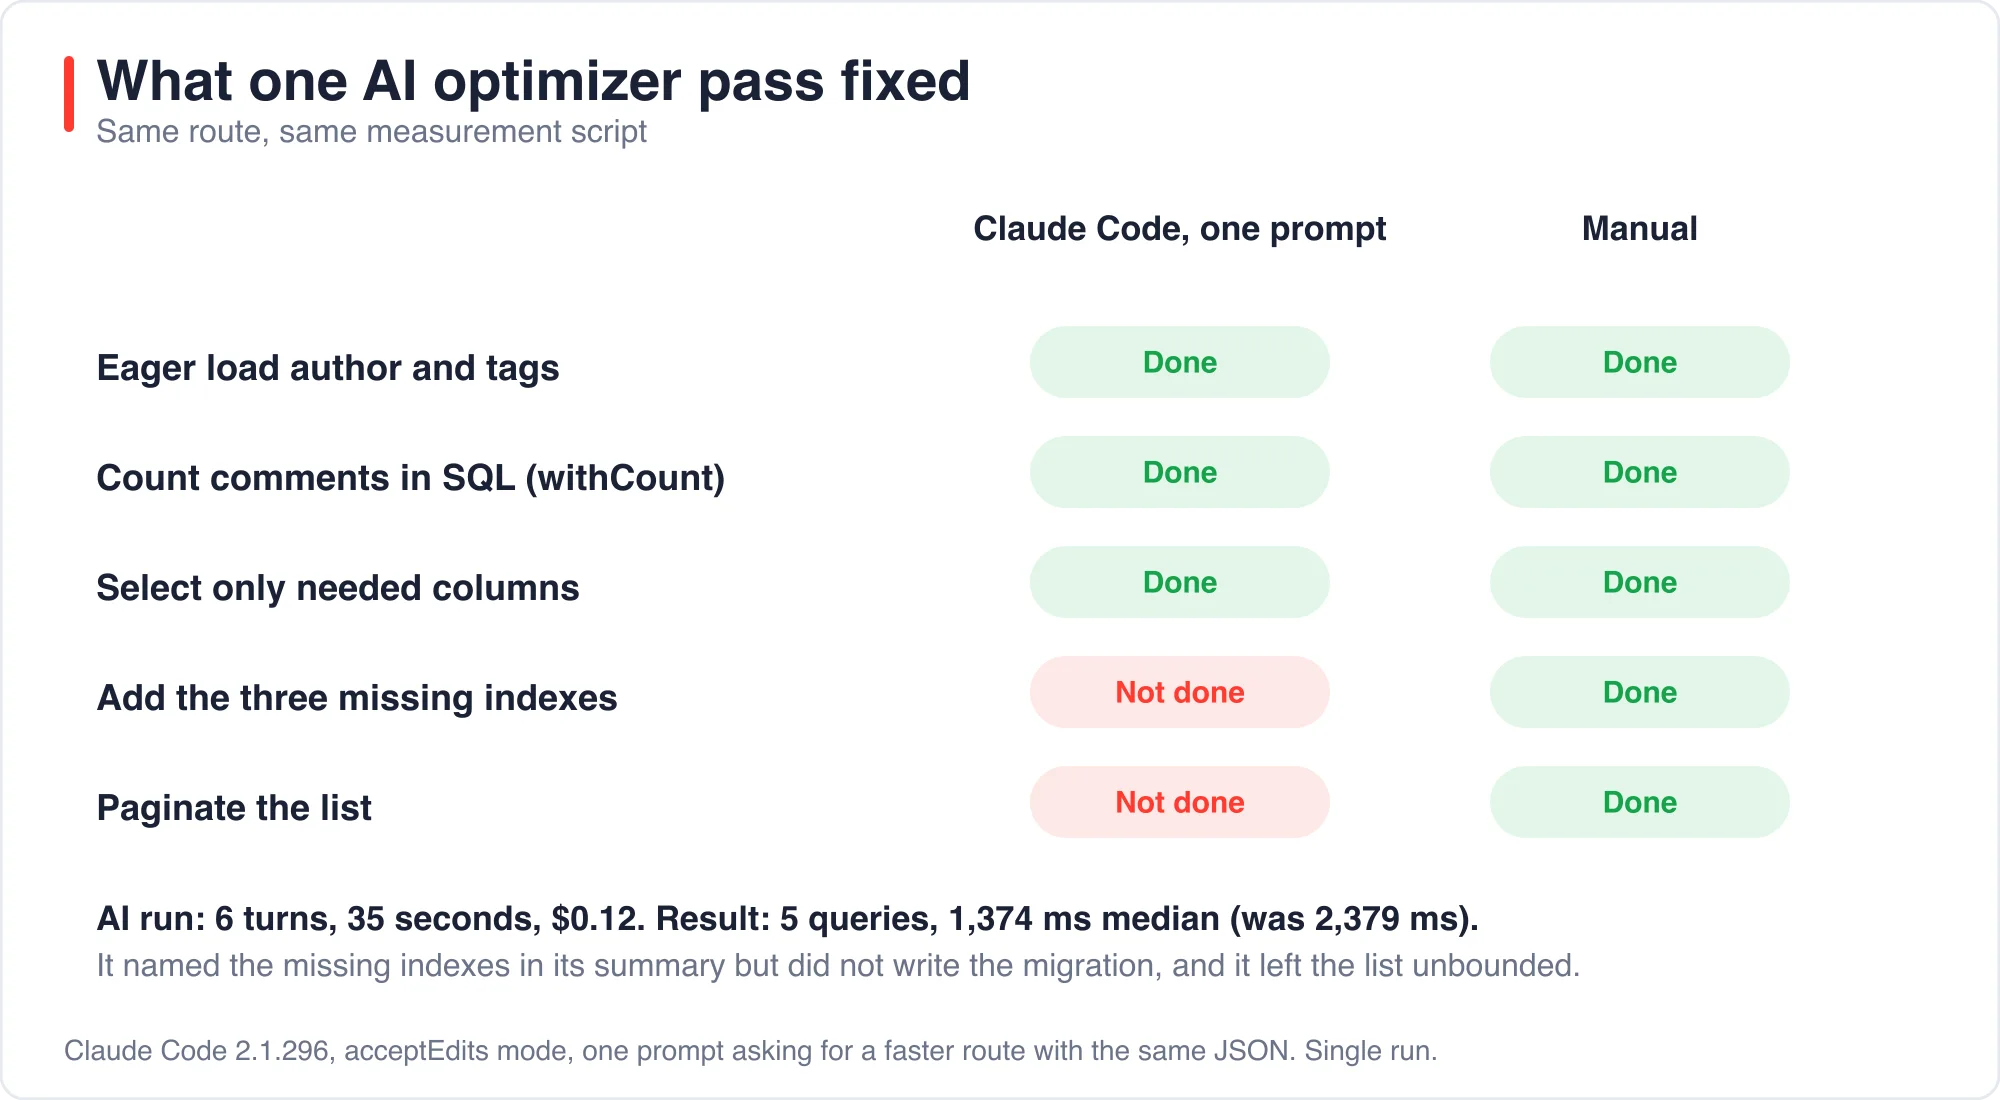
It finished in 6 turns and 35 seconds at a reported cost of $0.12. It added eager loading, replaced the comment collection with withCount, and dropped the body column. That matches my first two steps and my third.
| Fix | AI | Manual |
|---|---|---|
| Eager load | Done | Done |
| Count in SQL | Done | Done |
| Select columns | Done | Done |
| Add indexes | No | Done |
| Paginate | No | Done |
Its measured result was 5 queries and a 1,374 ms median, down from 2,379 ms. Its summary said the five queries still took about 1,212 ms in the database. It guessed the comment count and the published filter had no indexes. It named the two indexes but did not write the migration, because the prompt only mentioned the route.
I count that as a good result with one gap. The tool diagnosed the schema problem correctly and stopped at the edge of what I asked. It also did not paginate, which is correct, because pagination changes the response and I had told it not to.
This is one run. A second run may differ. The useful lesson is not the score but the boundary: an AI optimizer told to fix a route fixes the route. If the cause lives in a migration, say so in the prompt.
How do you keep an optimized route from regressing?
You keep it from regressing by making the framework and your test suite fail when a lazy load or an extra query appears. Two small additions do this.
The first is Laravel's lazy loading guard. The Laravel Eloquent documentation on preventing lazy loading describes Model::preventLazyLoading(), which throws an exception whenever code loads a relation inside a loop.
public function boot(): void
{
    Model::preventLazyLoading(! app()->isProduction());
}
I turned it on and called the naive route in a test. It threw LazyLoadingViolationException on the first article, which is the behaviour you want in development. It is off in production so a missed relation does not become an outage.
The second is a query budget test. It seeds a few dozen rows, calls the route and fails if the query count grows.
it('keeps the list route at a fixed query count', function () {
    seedArticles(30);

    DB::enableQueryLog();
    $this->getJson('/s3')->assertOk();

    expect(count(DB::getQueryLog()))->toBeLessThanOrEqual(5);
});
I ran this against the optimized routes and they passed. The same test against the naive route reported more than 60 queries for 30 articles, which shows the budget is tight enough to catch the regression.
Which fix should you do first?
Start with the fix that costs the least and removes the most. This table orders the four fixes by what they gave me, not by how clever they are.
| Step | Fix | Gain | Risk |
|---|---|---|---|
| 1 | Indexes | 2,326 to 847 ms | Write cost |
| 2 | Eager load | 5,361 to 5 queries | Low |
| 3 | Select columns | 48 to 46 MB | Low |
| 4 | Paginate | 182 to 4 ms | Changes response |
Indexes come first because they help even when you do not touch the code. Eager loading comes second because it is the change an AI tool or a review will most often catch. Pagination comes last because it needs agreement with the consumer.
If you want an AI to review the diff before it ships, see Which AI code review tool to trust with PRs. Treat its answer as a second opinion, and keep the query budget test as the hard check.
What are the limits of this test?
The limits are real. I ran SQLite on a laptop with 2,000 articles. MySQL and PostgreSQL have different planners, different caching and network latency between the app and the database. A production table with 20 million rows will behave differently from mine.
The 5,361 query count is exact for this dataset, because it follows from the row counts. The millisecond figures are not portable; the ratio between versions is the part to trust.
I also timed internal requests, not HTTP requests through a web server. The numbers exclude PHP-FPM, extra middleware and server-side JSON encoding. The AI result is a single run, and I did not repeat it.
Optimization work also has a maintenance cost that the benchmark does not capture. Every index slows inserts and updates slightly, consumes storage, and must be considered whenever a migration changes the table. For tables that receive heavy writes, measure the write throughput before and after adding an index, instead of assuming that faster reads are free.
Every figure in this post was fact-checked against the saved output of the bench script before it went in. About the author: I build Laravel apps for a living and ran each step on a scratch project. If you find a number that does not reproduce, use the contact page and tell me which one.
The bottom line
Measure first, then fix in this order: indexes, eager loading, column selection, pagination. An AI optimizer will handle the middle two quickly for about 12 cents. It will not add an index or paginate unless you say so.
Put preventLazyLoading in your service provider and one query-budget test beside each list route. Those two lines of defence cost almost nothing and stop the 5,361-query route from coming back.
Advertisement
FAQ
How do you fix N+1 queries in Laravel?
Load relations before the loop with with() and count related rows with withCount(). In my test this cut a route from 5,361 queries to 5. Turn on Model::preventLazyLoading() in development so a missed relation throws an exception instead of silently adding queries.
Why is my Laravel route still slow after eager loading?
Missing database indexes are the usual cause. SQLite and the migrations Laravel generates do not index foreign keys, so each lookup scans the table. Adding three indexes took my eager-loaded route from 1,395 ms to 194 ms.
Can an AI code optimizer fix a slow Laravel route?
It can fix the code in the route. Claude Code added eager loading, withCount and column selection in one prompt for $0.12. It named the missing indexes but did not write the migration, and it did not paginate, so say so in the prompt.
How do you stop N+1 queries coming back?
Add a query budget test that seeds a few dozen rows, calls the route with DB::enableQueryLog() and fails if the count passes a limit. Pair it with Model::preventLazyLoading() in your service provider so development fails fast.
Comments
Loading…
Sign in to join the conversation.
Related posts

Laravel AI SDK Tool Approval: Edit Works, Fakes Skip It
The Laravel AI SDK can pause an agent before a sensitive tool runs and wait for a person to approve, reject or edit the call. I ran that human-in-the-loop tool approval API through 16 scenarios and
Sat Oct 10 2026 · 10 min read · 0 views

PHPStan Found 3 of 11 Laravel Bugs. AI Found 9 to 11
PHPStan at level 9 found 3 of the 11 bugs I planted in a Laravel pull request. It took 1.1 seconds and cost nothing. An AI reviewer found 9, 11 and 9 in three separate runs, in about 15 seconds each,
Sat Oct 10 2026 · 10 min read · 0 views

AI QA Testing in Laravel: 3 Bugs Only a Browser Test Sees
Claude Code wrote a Pest browser test for a Laravel form, and it passed on the first run; then I broke the page seven ways. The browser test caught 3 of the 7 breaks; a plain HTTP test caught a
Sat Oct 10 2026 · 11 min read · 0 views